Dems release more district maps
As debate begins on GOP redistricting proposals, Democratic legislators release several maps of their own.
Posted — Updated
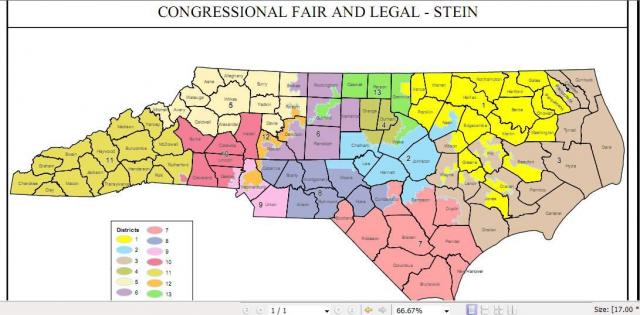
Two more new maps came out this morning: the Senate Democrats’ alternative congressional plan, and a proposal for Senate districts from the Legislative Black Caucus.
House Democrats are expected to release their own House map around 2:30 this afternoon.
Under the Dems’ plan, four districts – 3, 5, 6, and 10 - would have voted for McCain by more than 55%, and four districts – 1, 4, 12, and 13 - would have voted by the same margin for Obama.
The remainder – Districts 2 (Ellmers), 7 (McIntyre), 8 (Kissell), 9 (Myrick), and 11 (Shuler) would all be in swing territory.
By comparison, the latest GOP congressional map has 8 districts that went 55+% for McCain, 2 that voted for McCain at more than 54%, and 3 – districts 1, 4 and 12 - that would have voted Democrat.
Like the Senate Democrats’ map, it contains 4 districts where the majority of registered voters are African American. But it doesn’t create any majority-minority districts where the BVAP (Black voting age population) reaches 50%
The LBC map includes a lot of country groupings that neither the Senate Dems nor the GOP came up with. Its district deviations are slightly higher than the other two plans, but all fall within the allowed 5% margin.
Copyright 2024 by Capitol Broadcasting Company. All rights reserved. This material may not be published, broadcast, rewritten or redistributed.


